Contents
Intro
Some time ago, I wrote a long post on building an observability stack at my workplace using ClickHouse and Grafana. [1]
There, I made a promise to write on how I analyze NGINX access logs at “some point in the future.” I didn’t want to write about something I don’t use, or that is half-baked, so I let it unfold organically. Now, the time has come.
The NGINX access dashboard is fairly complete at its current state, and undergoes changes quite rarely. They’re cosmetic, mostly.
This project proved to be useful many times throughout a span of half a year. Which means, it’s not a mere experiment anymore.
To demonstrate how this thing can be useful, let me tell you a little story happened to me.
A Weird Weekend
One Saturday morning, I opened my eyes and habitually checked my phone for notifications. A Zabbix alert — one of the sites is down.
Trying to verify. The website isn’t loading.
What the heck happened?!
Next moment, I found myself with my upper body hanging down the bed, swiftly typing on my laptop placed on the floor. Quickly examined the server — resources usage OK. Restarting PHP, no use.
Logging into Grafana. A sudden traffic spike, tons of server-side errors. An ad campaign? No, doesn’t seem like it.
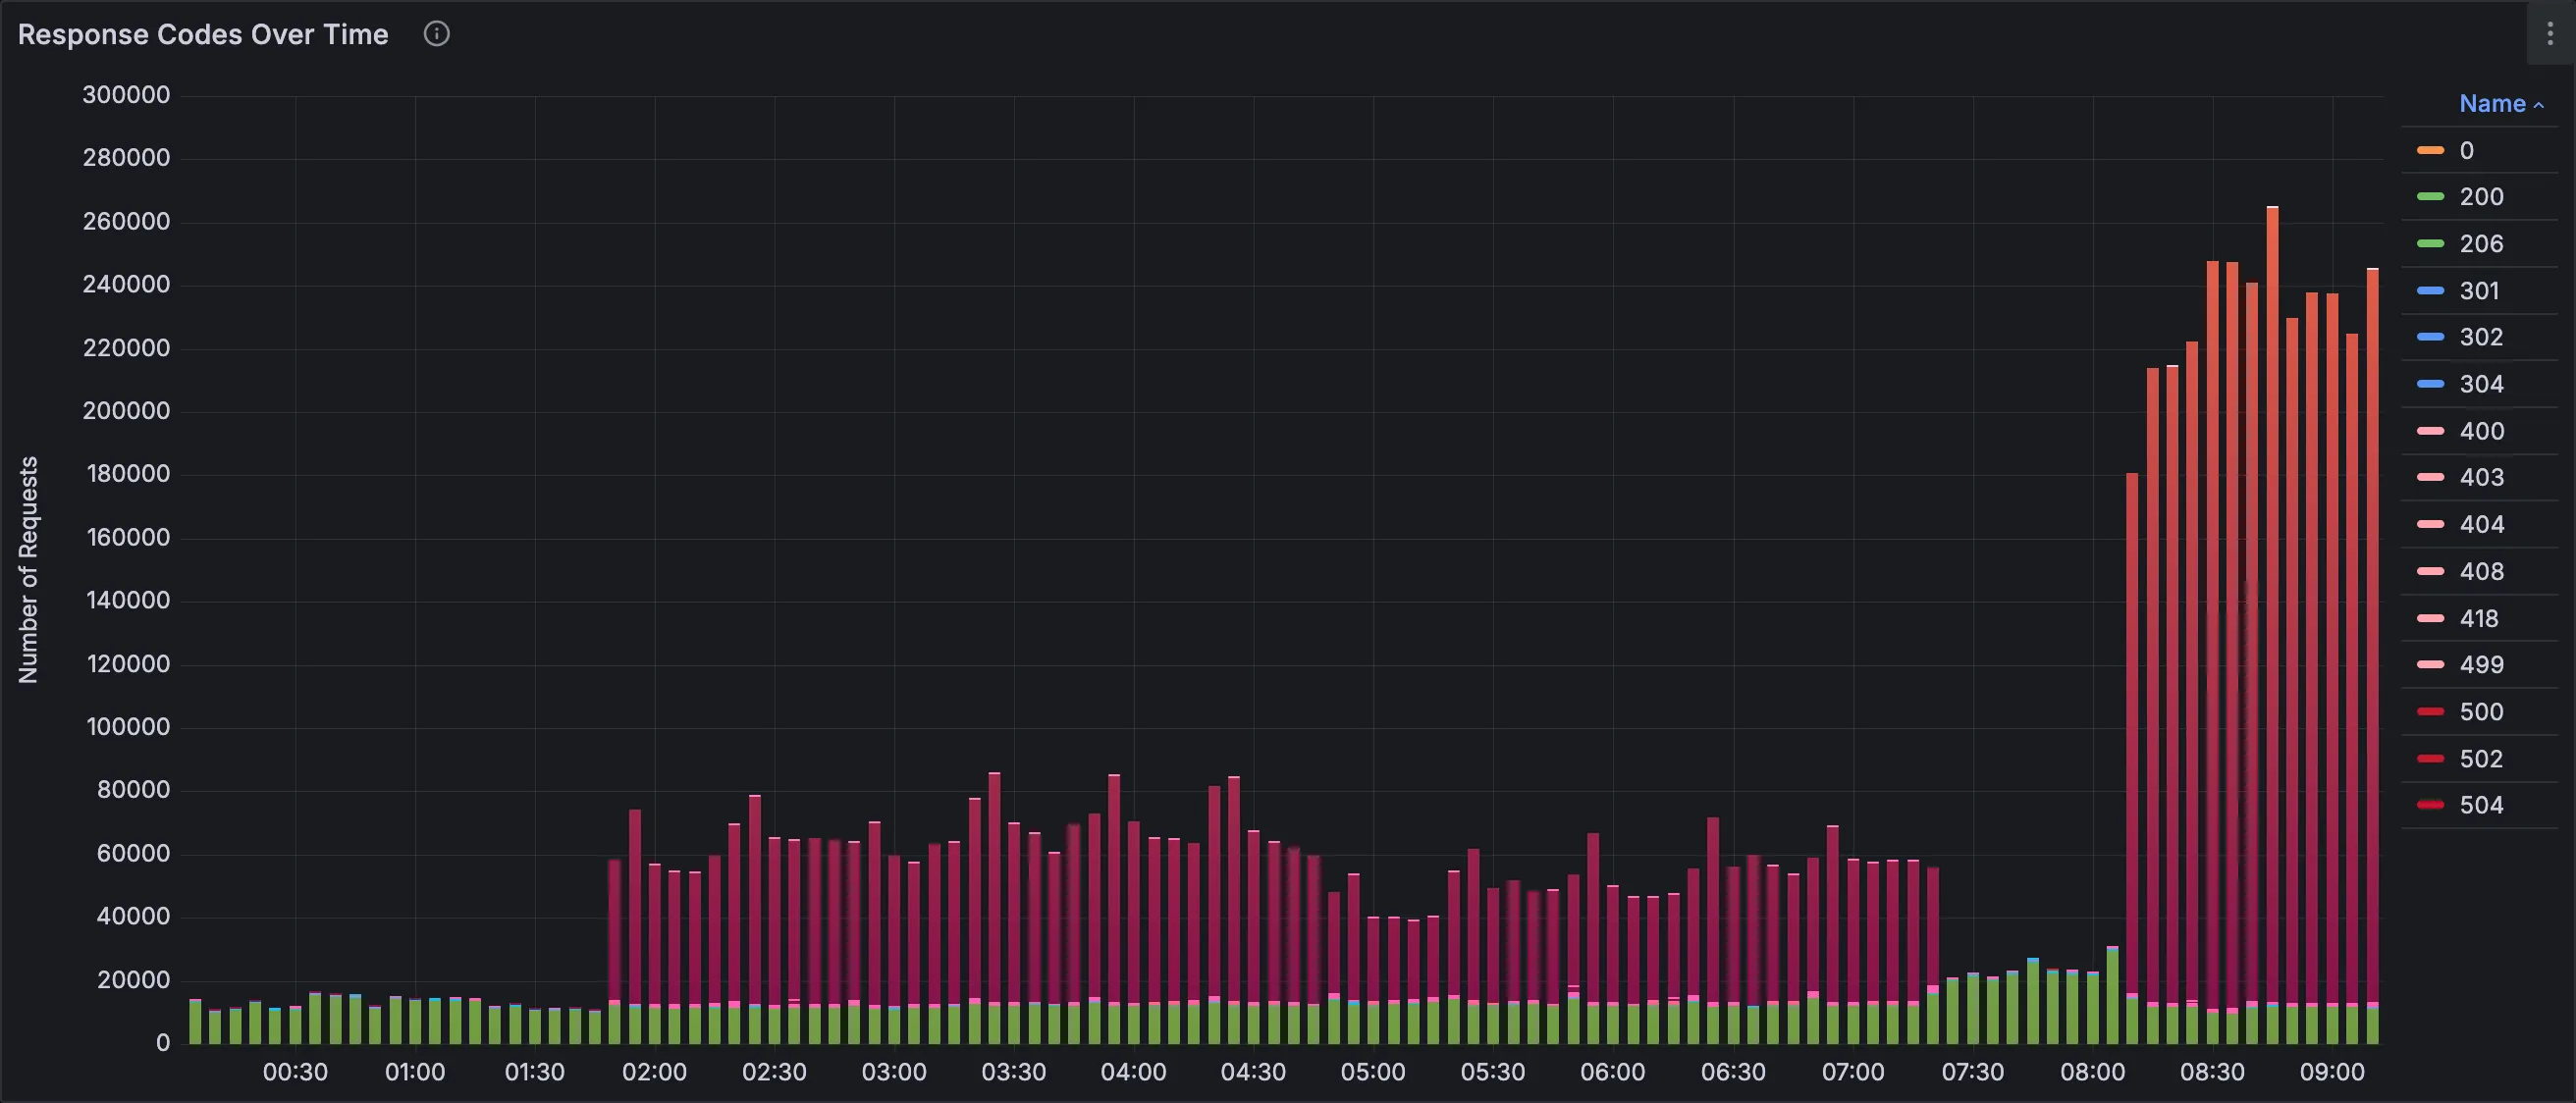
Changing the time range to grab the last 12 hours.
Huh! Here it is, the errors first appeared at night, but the website didn’t go down completely until now.
Is that a DDoS? But we have an anti-DDoS protection 🤔.
Playing around with dashboard filters, analyzing panels.
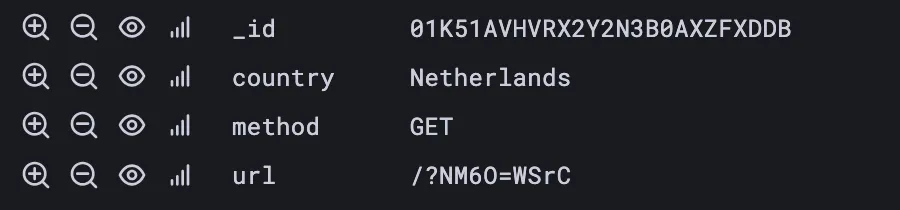
Identified the root cause. A bunch of bots sending requests of the format ^/\?[A-Za-z0-9]{4}=[A-Za-z0-9]{4}$.
Connecting to ClickHouse using CLI, dumping a list of IP addresses, piping ‘em down AWK formatting as NGINX deny statements.
Reloading reverse proxy config…
The site is back in operation. Phew 😤.
Trying to contact colleagues who can reach out to our anti-DDoS protection service. About an hour later, the botnet’s traffic is blocked on the network level.
Monday morning. Dumping Saturday’s DDoS request stats by countries in Markdown format using ClickHouse’s FORMAT statement.
Forming a security incident report.
The overall attack lasted about 24 hours, starting at night. Offending requests came from over 20 countries. Most of them were blocked by our anti-DDoS provider.
To be honest, I had a ton of fun despite a rush of adrenaline trying to figure out what’s going on at the time. Moments like this bring unmatched levels of satisfaction to my life.
Love my job ❤️.
Panels Overview
Now, here’s a short summary of what you’ll find on this dashboard.
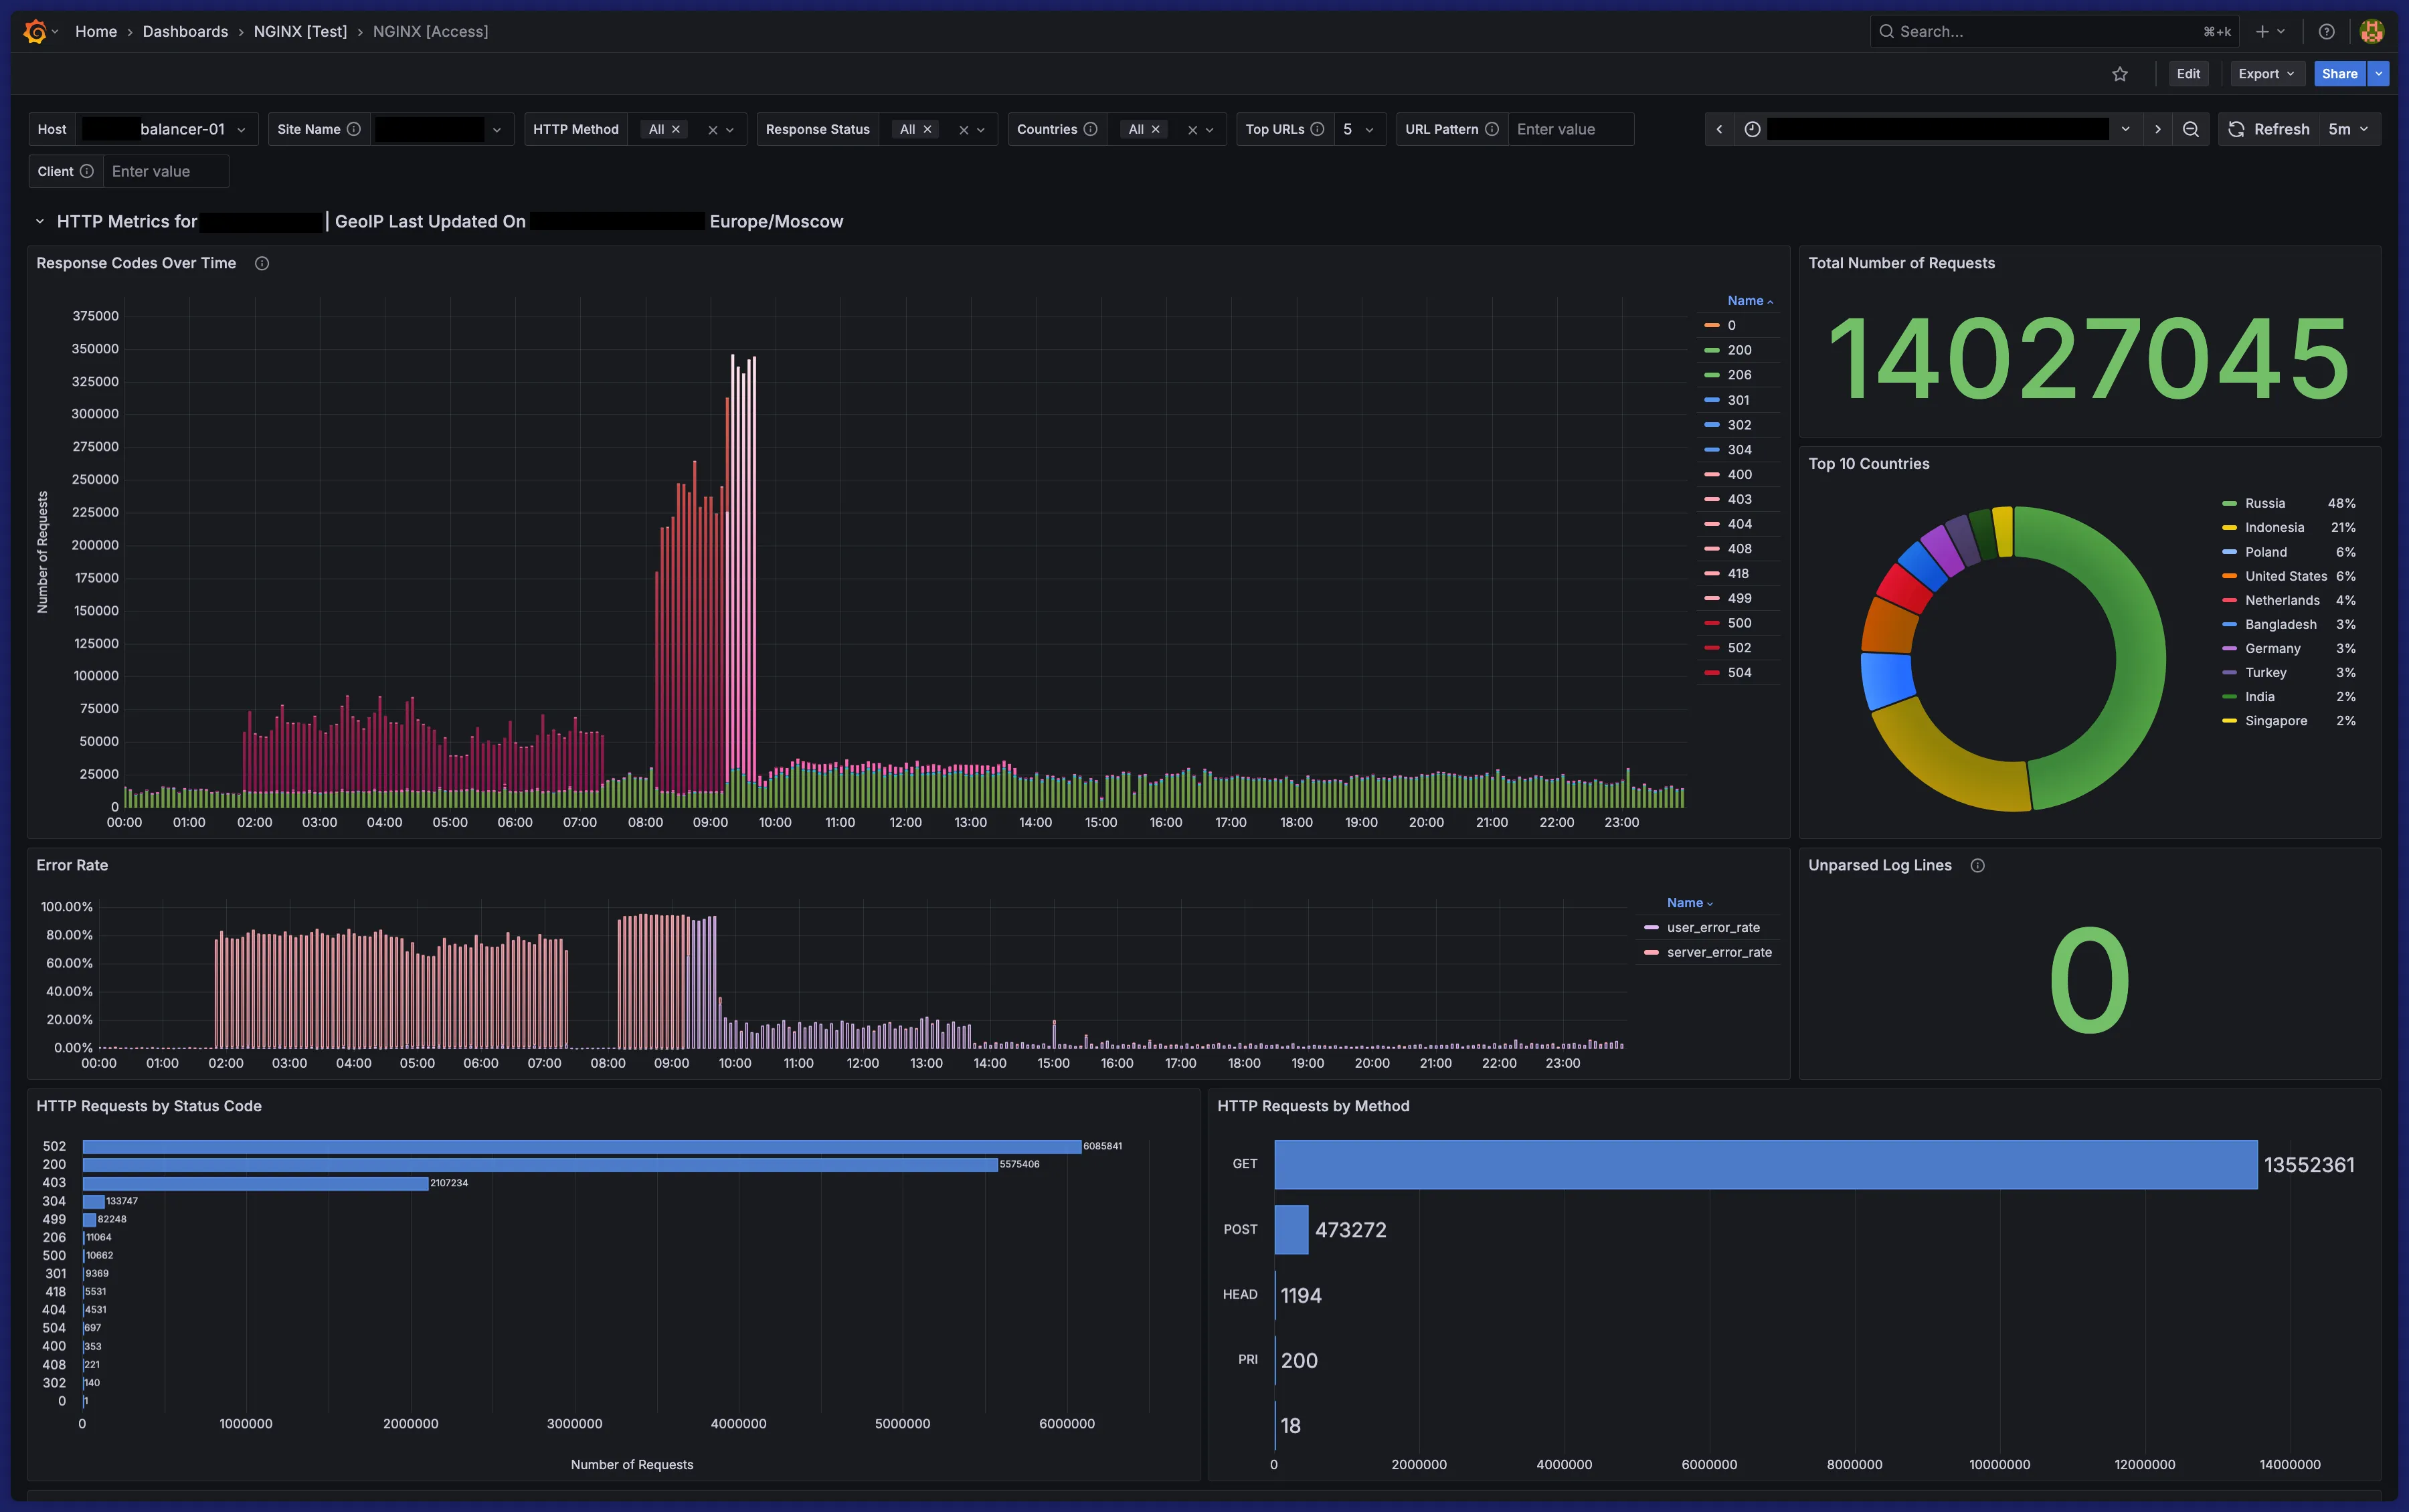
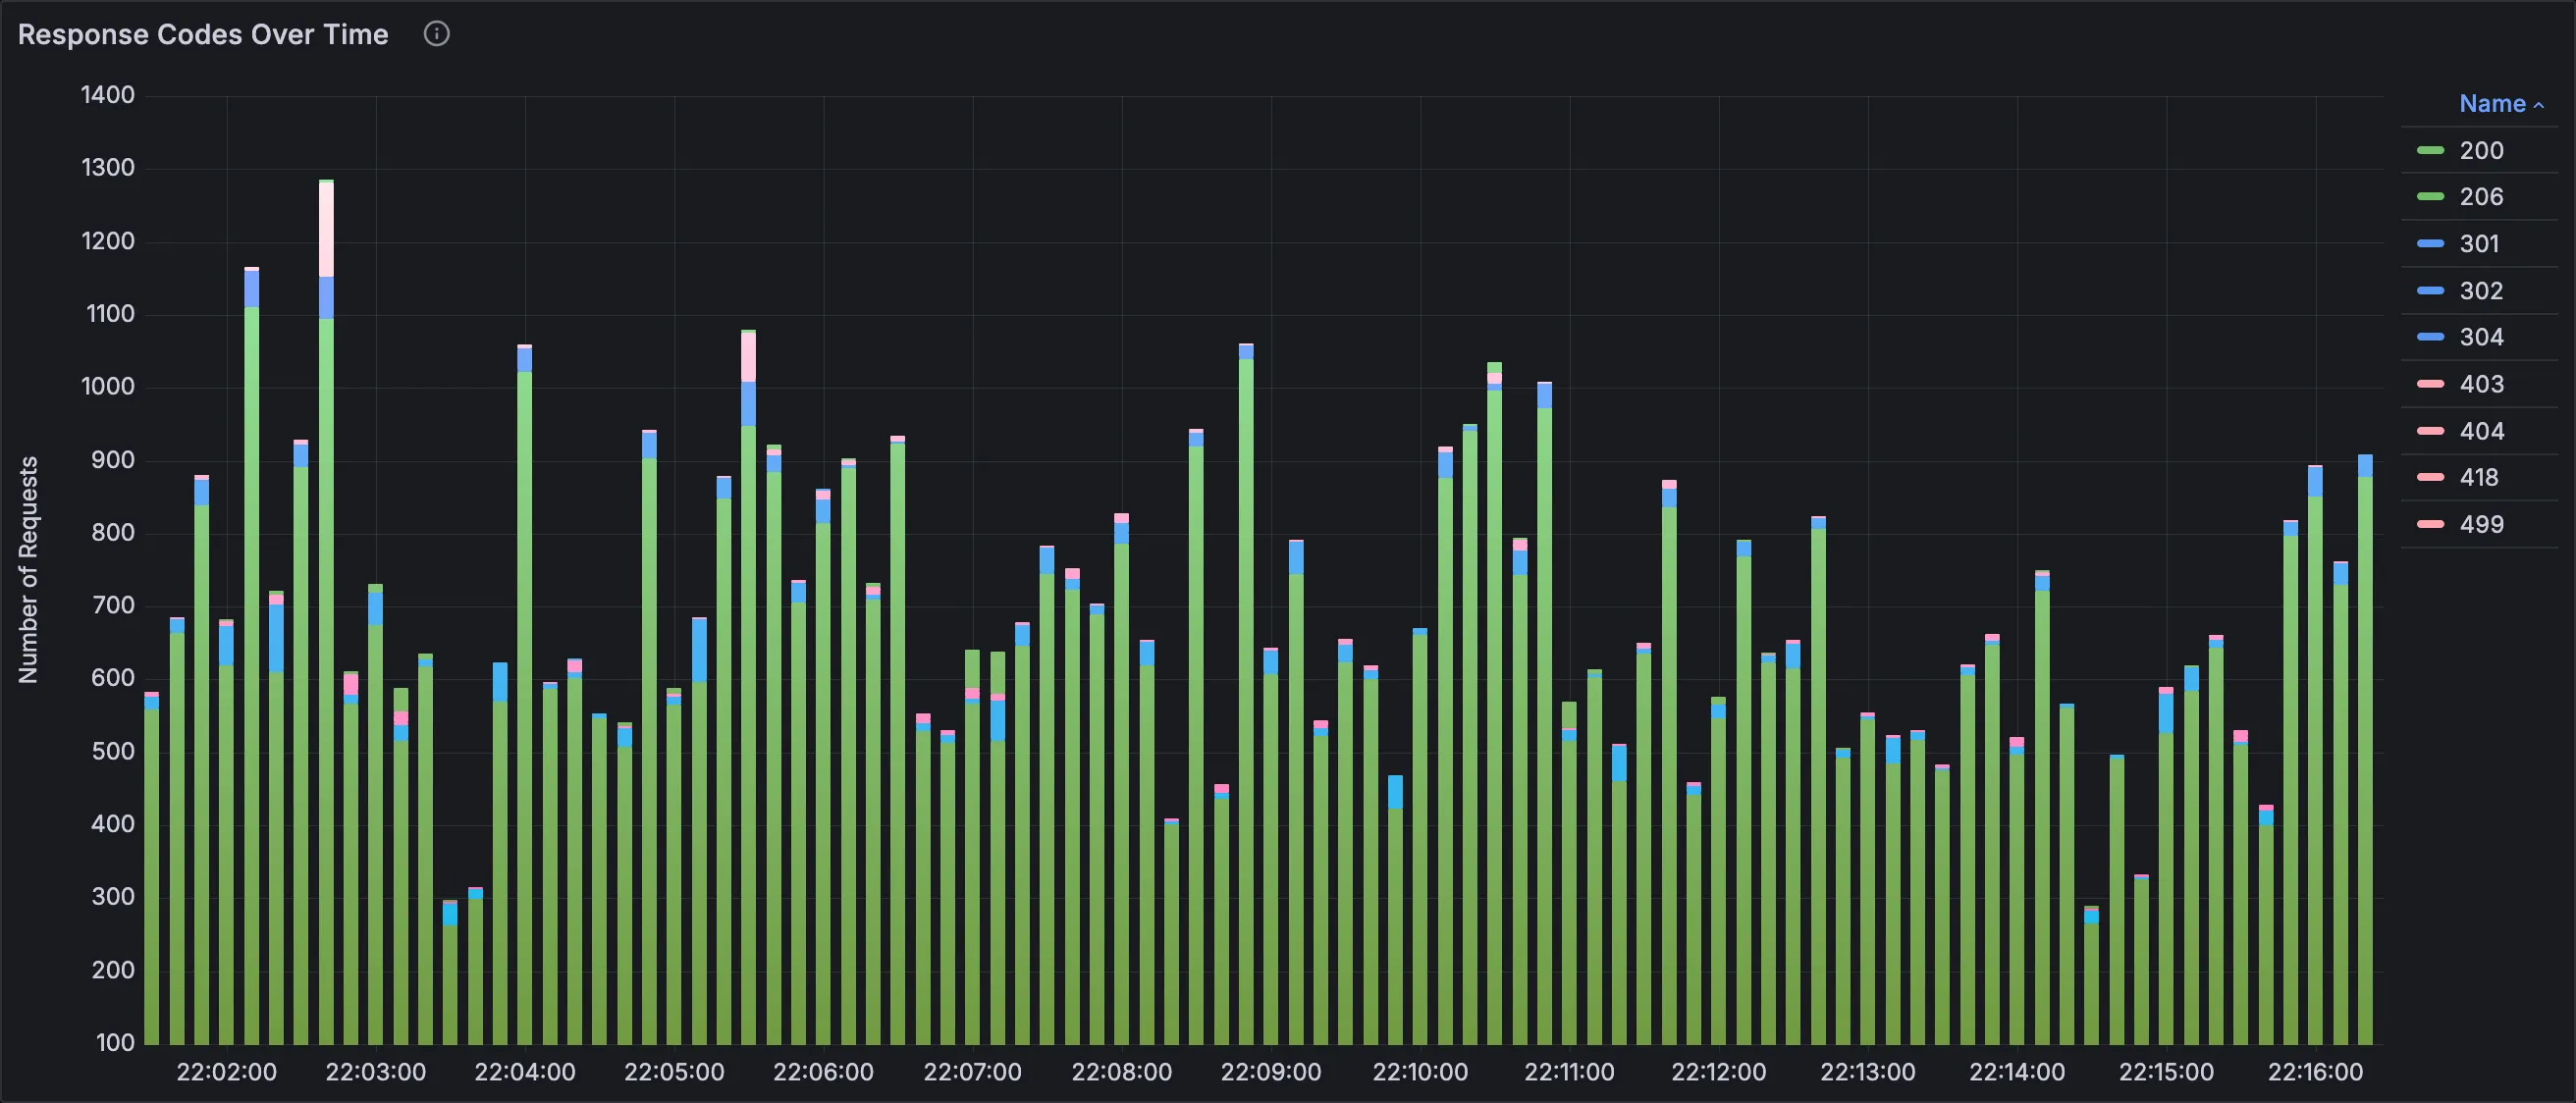
Response Codes Over Time
Stacked bars visualizing hits colored by HTTP status code. Time binning is dynamic.
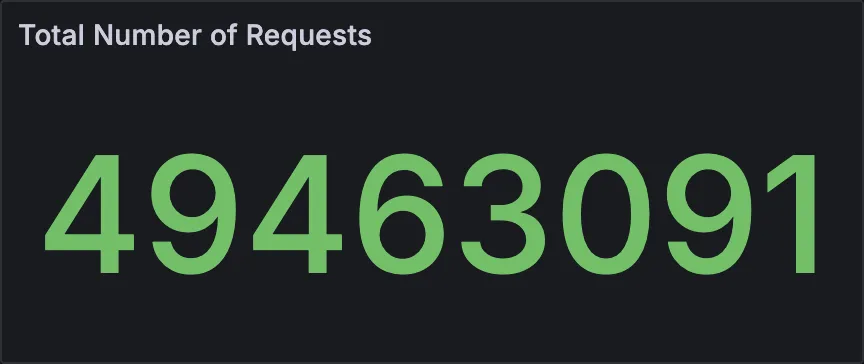
Total Number of Requests
Overall hits.
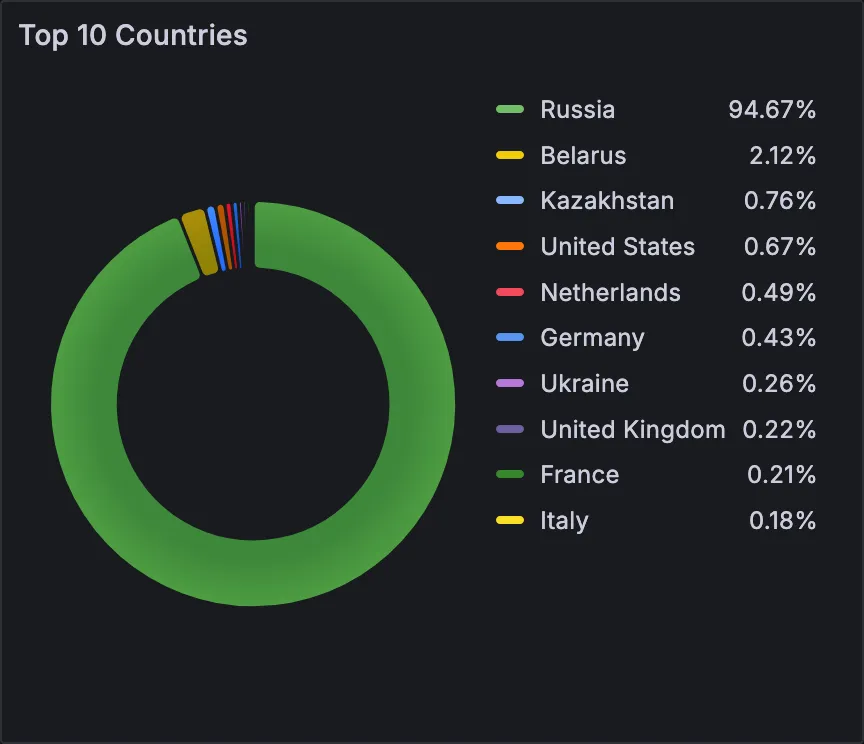
Top 10 Countries
A pie chart with the top 10 countries.
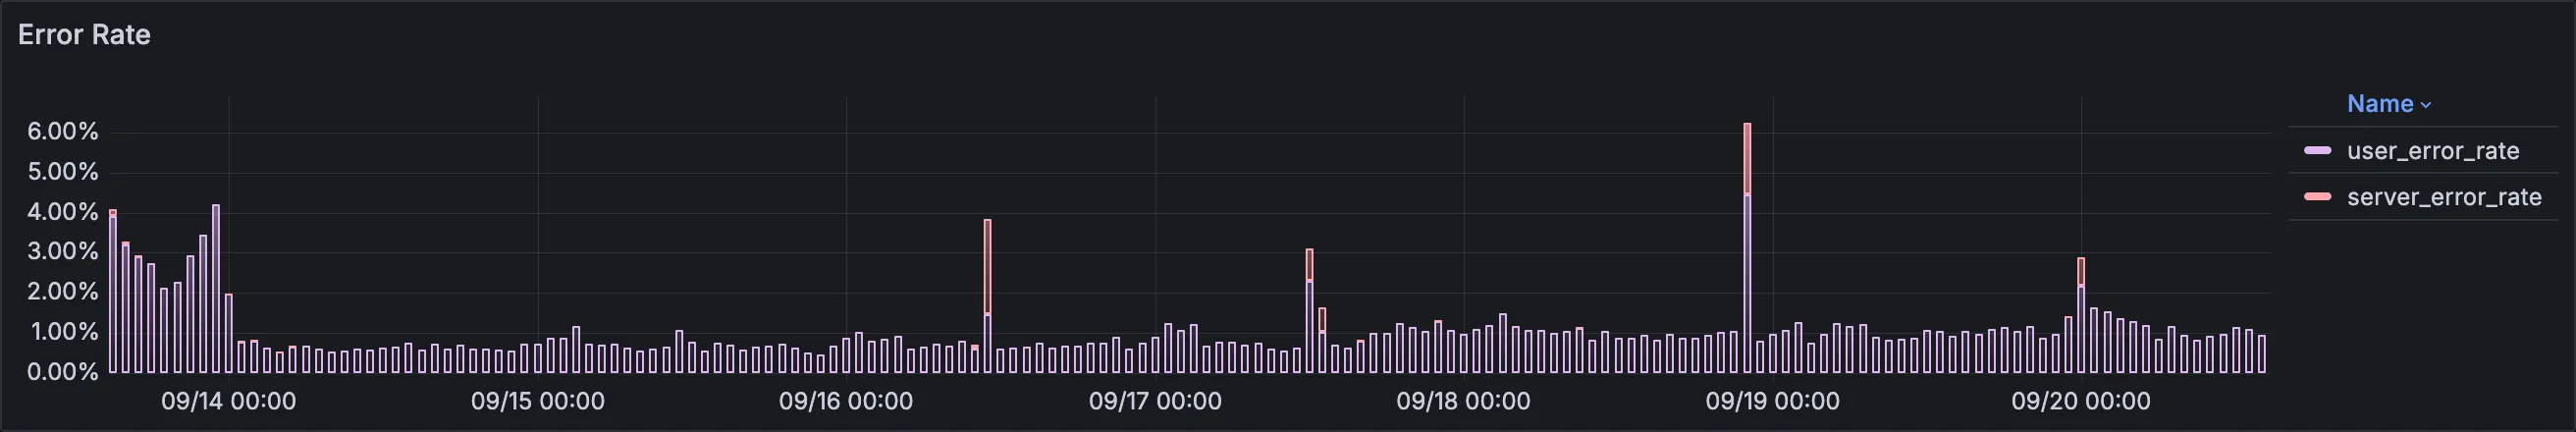
Error Rate
Stacked bars chart with user- and server-side error rate calculated using a errors / hits * 100 formula.
Dynamic time binning.
Unparsed Log Lines
How many log lines the log collector couldn’t process, and ingested as-is. They are determined by a null HTTP status.
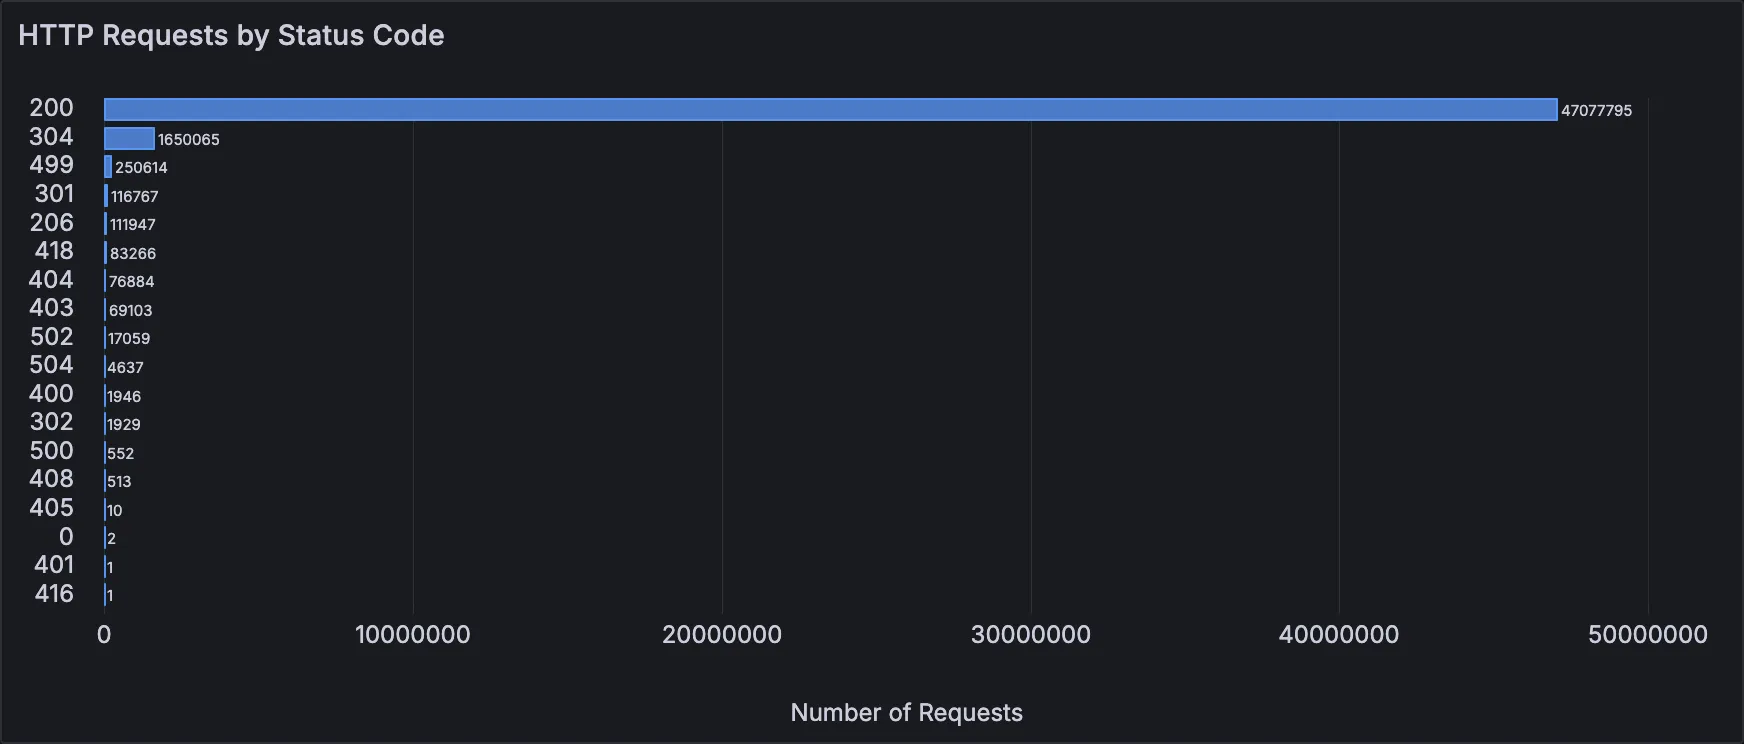
HTTP Requests by Status Code
A bar chart depicting a number of requests grouped by an HTTP status code.
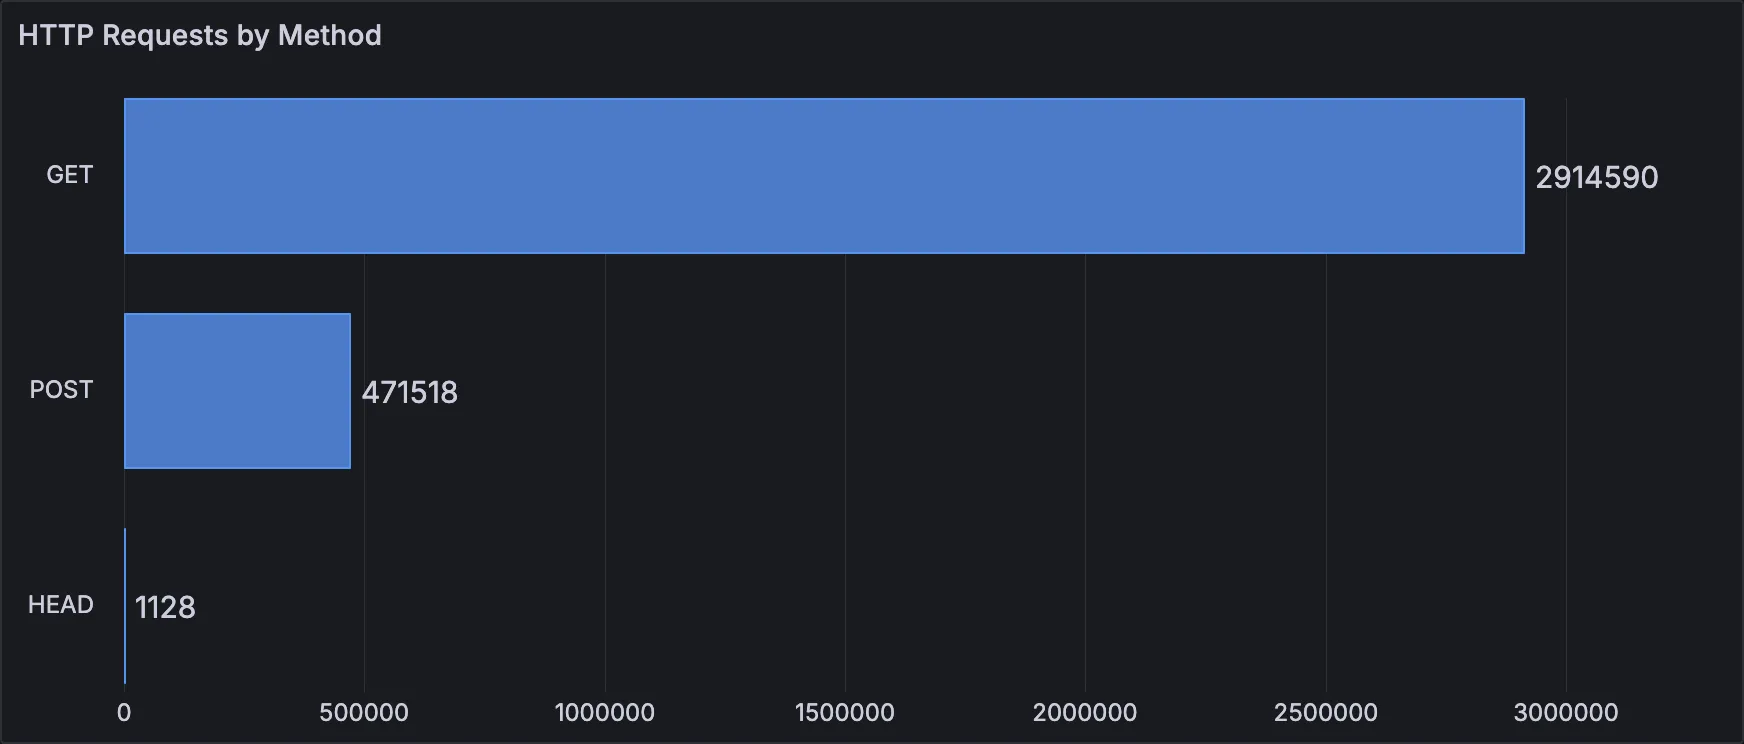
HTTP Requests by Method
Also a bar chart, but showing a number of HTTP requests grouped by an HTTP method.
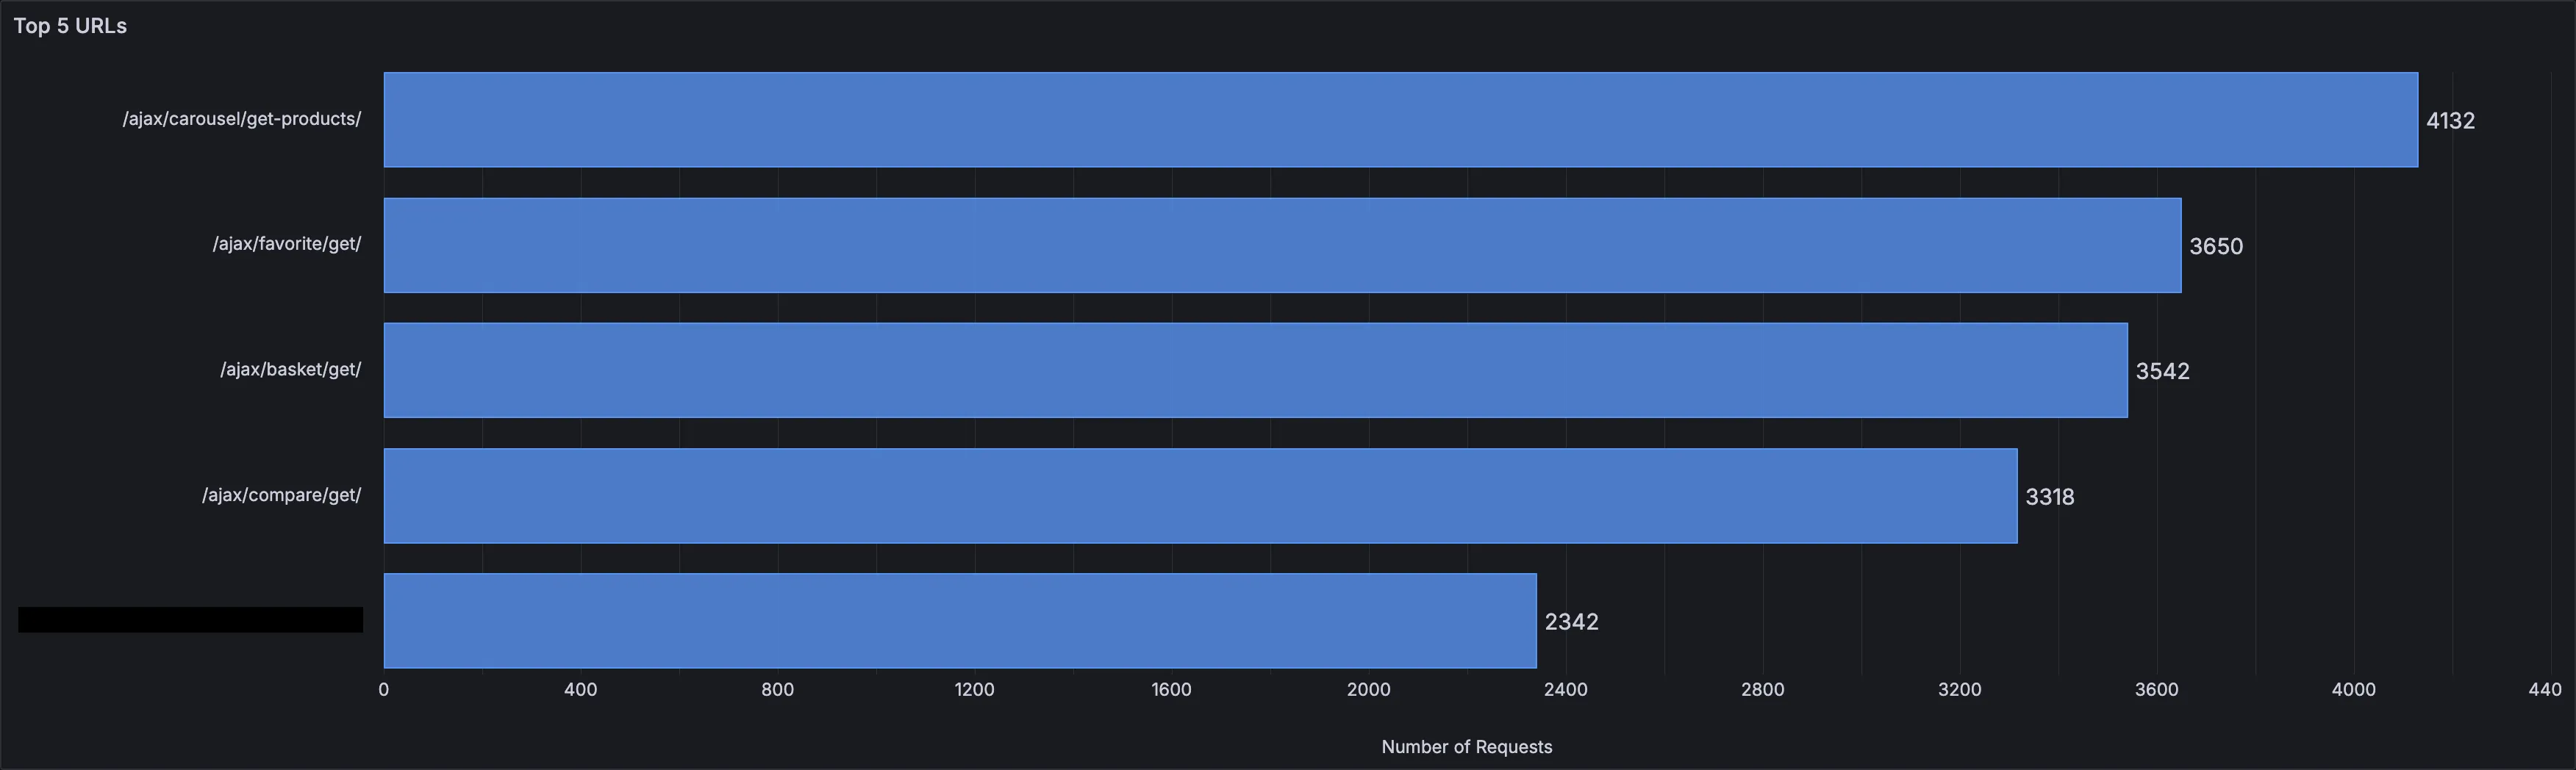
Top N URLs
Top N URLs based on the drop-down filter at the top of the dashboard. The range is 5..20 with a step of 5.
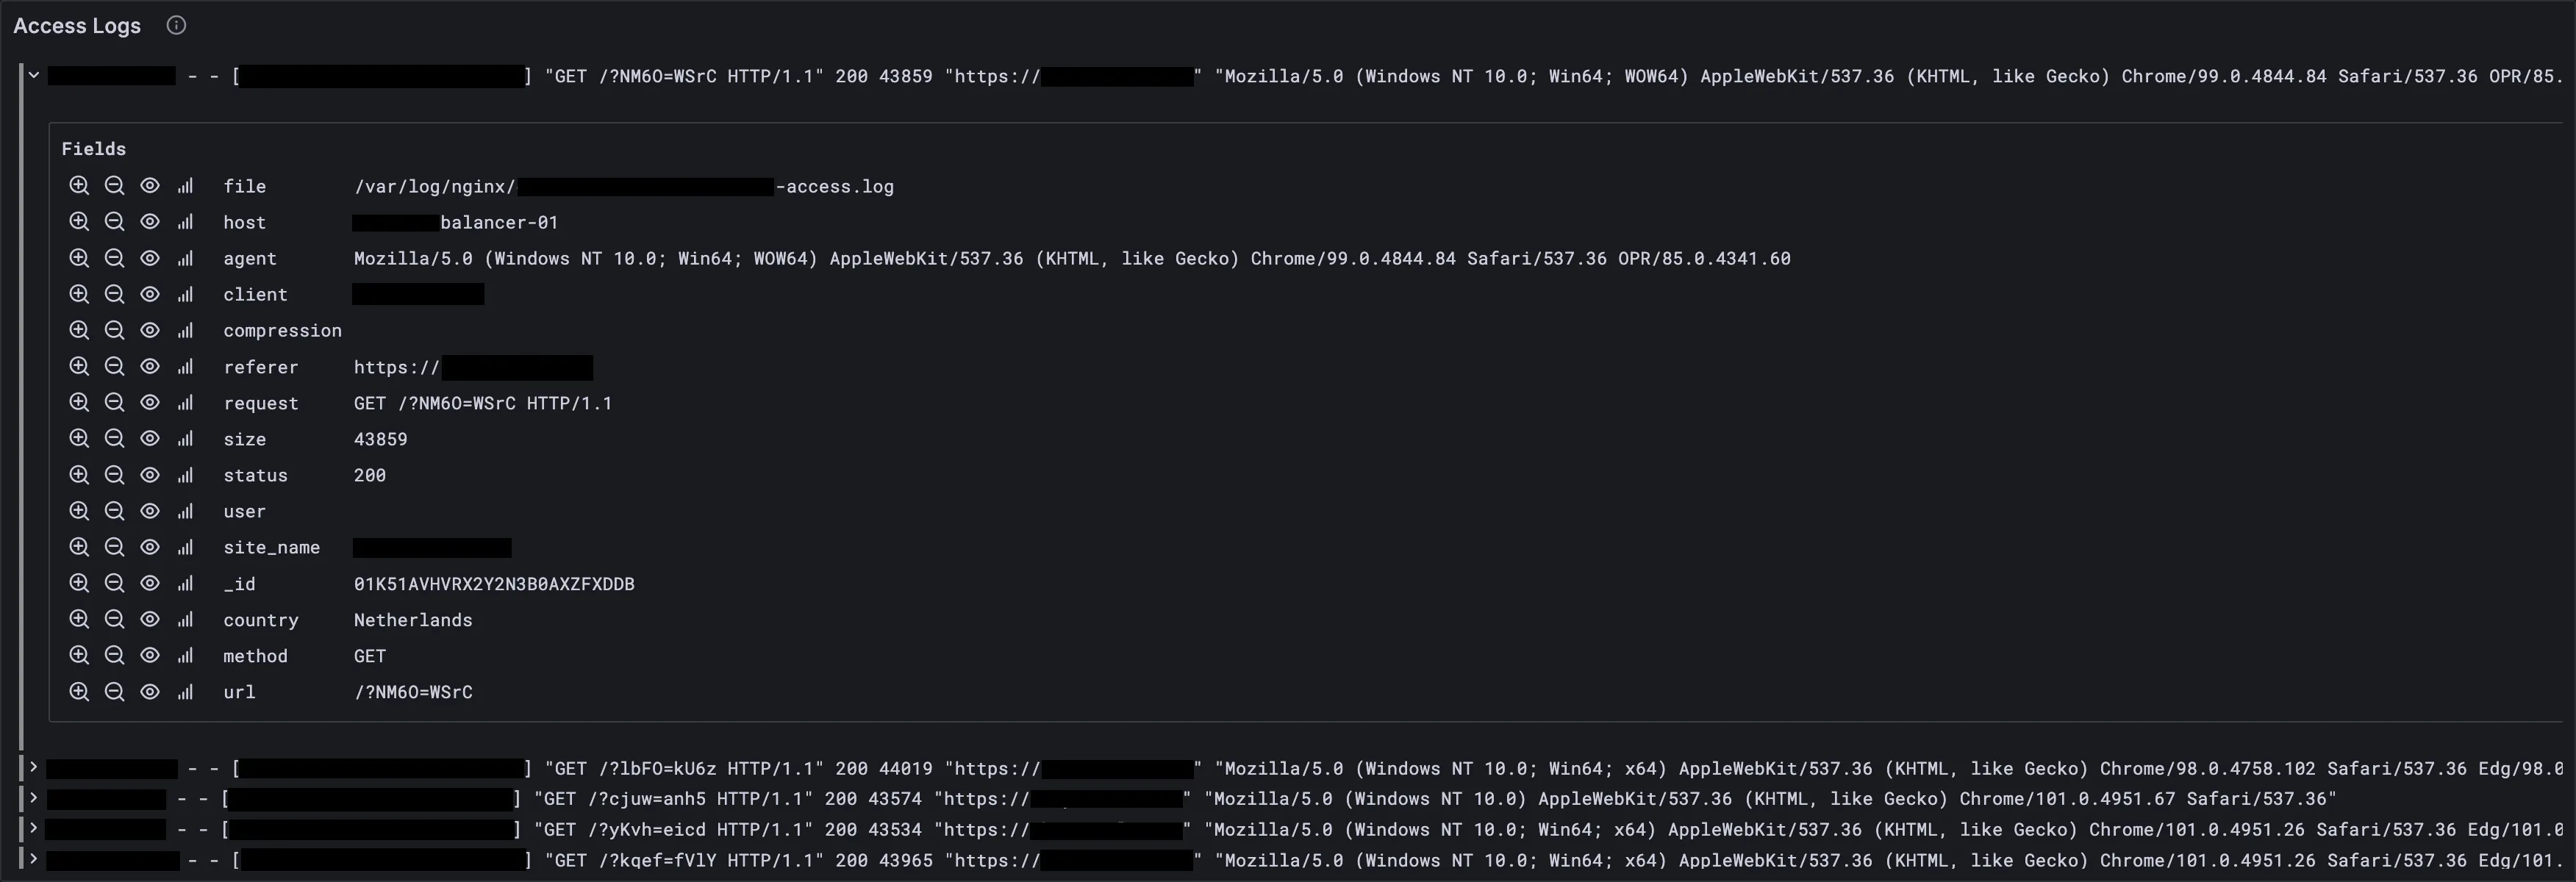
Access Logs
Last 1000 access logs sorted newest to oldest. It’s in the Logs row at the bottom of the dashboard.
Implementation Notes
The dashboard contains WHERE filters inside of panels’ queries.
They are based on variables found in the dashboard settings.
WHERE
    $__timeFilter(time)
    ...
    AND if('${response_status:raw}' = 'ALL_STATUSES', true, status IN array(${response_status:raw}))
    AND if('${countries:raw}' = 'ALL_COUNTRIES', true, country IN array(${countries}))
    AND if('${url_pattern}' = '', true, match(url, '${url_pattern}'))
    ...
All of those ifs are there for a reason — that’s a performance optimization. Remove them, and queries will take longer.
${} are macros from the Grafana ClickHouse plugin. You can learn more about them on the
plugin’s page.
In the ClickHouse table several columns are materialized in order to shift processing from log collector to the database itself.
CREATE TABLE nginx.access
(
    ...
    `_id`         FixedString(26)  DEFAULT      generateULID(),
    `country`     String           MATERIALIZED coalesce(nullIf(lookupIPv4(client, 'country_name'), ''), 'NONE'),
    `url`         String           MATERIALIZED regexpExtract(request, '^([A-Z]+)\\s(.*)\\s+', 2),
    `method`      String           MATERIALIZED regexpExtract(request, '^([A-Z]+)\\s(.*)\\s+', 1)
    ...
)
ENGINE = MergeTree
ORDER BY (timestamp, host, site_name)
TTL timestamp + INTERVAL 15 DAY
👆 The country materialized column is calculated by extracting geoip data as I wrote in this article.
Summary
Now you have a basic idea of how such a dashboard can help you in your daily operations, and can implement it using the code provided in this article.
Read Next
Building SQL-based Observability With ClickHouse and GrafanaEndnotes
[1] The funny thing is, this post somehow made its way to the ClickHouse December 2024 newsletter.